

March 20, 2021 6-8-ratios-and-proportional-relationships
By: Jeff Todd
I have always liked finding ways to use manipulatives to teach about math. For some students, taking hold of ideas comes from taking hold of physical objects! And what I am sharing in this post will certainly help students learn about ratios and proportions by drawing a representation. That’s where using a tape diagram in math class will help students.
What is a Double Tape Diagram?
A tape diagram is a visual model used to illustrate number relationships and assist with mathematical calculations, commonly when solving word problems. The rectangular shape of this tool resembles a strip of tape which can be segmented to represent known and unknown quantities in a problem. A double tape diagram is used to model two different tapes and typically used when comparing within a problem.
Ratios and Proportions in Grades 5–7
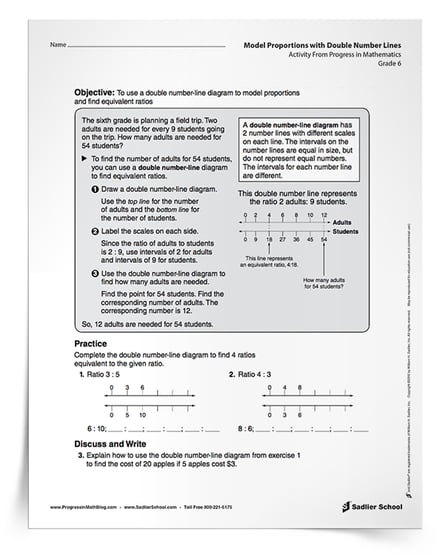
Common Core Standard 6.RP.3 is: Use ratio and rate reasoning to solve real-world and mathematical problems, e.g., by reasoning about tables of equivalent ratios, tape diagrams, double number line diagrams, or equations. The download for this post is two pages with solutions from the Progress in Mathematics® online resources to model proportions using number lines and tape diagrams. If you are using the Progress in Mathematics® curriculum series, these pages would be good extensions for Chapter 11, Lesson 4 in the Grade 6 book.
The standard talks about equivalent ratios, and I think that’s a little odd, because it could simply have used the word proportion. A proportion is a statement that two ratios are equal, and can be written in three different ways:
-
In words—a is to b as c is to d
-
Using colons—a:b::c:d or a:b = c:d
-
Using fractions—a/b = c/d
Ratios and proportions were specifically incorporated into Greek philosophy and mathematics hundreds of years before the Common Era. For example, Euclid wrote about them in his important work, Elements, in which six of 13 books are about ratios and proportions. These have always been an important part of logical and mathematical reasoning.
For this reason, there is a strong emphasis on ratios and proportions in Grades 5 to 7. There are many ways that students can learn about proportions in their current study of fractions, and later in geometry using similar figures. Nonetheless, in this post, I am focusing on using double number lines and a double tape diagram in math.
The basic idea is to create two side-by-side number lines or tape diagrams with the zeros matching up. You can give a simple situation like: the ratio of cats to dogs is 2 to 3. Students then mark off their double tape diagram in math notation by skip counting and lining up the numbers as shown on the diagram below.
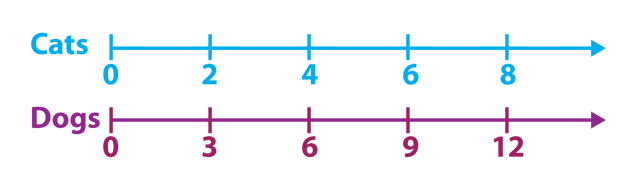
Students can set up proportions without doing any calculations, which develops an understanding of proportional reasoning. In Grade 7 and above, more formal ways of using algebra to solve proportions is appropriate, but in Grades 5 and 6, students should use a double tape diagram in math both to develop the idea and to solve problems.
Don’t be afraid to take this idea a little deeper with students by using fractions and decimals! This will help their reasoning and develop their number fluency. Use baking scenarios to setup up double number lines or tape diagrams. For instance tell students that Joe’s recipe for six muffins uses ¾ cup of flour, and have them draw out a double tape diagram that shows equivalent ratios.
Model Proportions with Double Number Lines Activity
So jump right on in with students by clicking on the download that will give your students completed examples and several situations in which to practice modeling proportions using double number lines or a double tape diagram in math. The solutions are also provided.