
Mathematics
Progress Mathematics
Grades K–8
Reading & Writing
From Phonics to Reading
Grades K–3
Building Reading Success with Wiley Blevins
Grades K–8
Vocabulary
Vocabulary Workshop, Tools for Comprehension
Grades 1–5
Vocabulary Workshop Achieve
Grades 6–12+
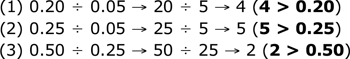
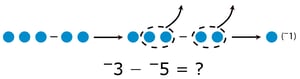
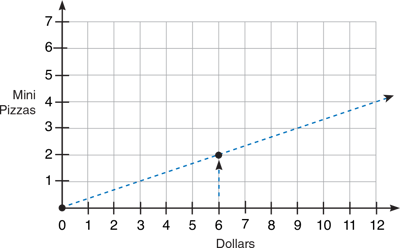
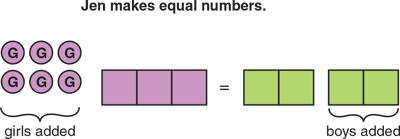
|