

February 3, 2025 k-2-measurement-and-data, 3-5-measurement-and-data, 6-8-ratios-and-proportional-relationships, other-seasonal
By: Jeff Todd
What is better than free printable holiday math worksheets? Holiday math worksheets that are cross-curricular! In this article, I'm sharing fun (and FREE) Presidents' Day worksheets that connects math and history. So, whether you are looking for a great activity for Presidents’ Day or just working in your classroom on a unit about presidents, the U.S. Presidents Line Plot Activity is for you! It is quick and easy to get going...all you need to do is download my FREE Presidents' day worksheets.
FREE Presidents' Day Activity for Math
With the U.S. Presidents Line Plot Activity, students will create line plots using the letters in each presidents' first and last name. This is a great activity for Presidents' Day, but can also be used any time of the year! If you are doing a unit on the U.S. Presidents, then this line plot activity will help students to learn the names of the Presidents. There’s even some great trivia to learn, such as which presidents had the longest names.
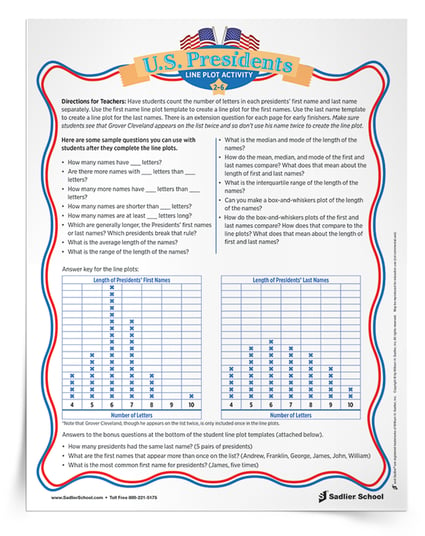
When you download my Presidents' Day activity PDF, you'll get:
- List of U.S. Presidents
- First name line plot template
- Last name line plot template
- Instructions for teachers
- Questions to use with students after they complete their line plots
- Answer key

Using Line Plots Across Grade Levels
Creating line plots is an appropriate activity for a wide range of grade levels. Students simply need to count the length of the presidents’ names—that will provide the data for the line plot. You can do a line plot for the first names, the last names, or both.
One important anomaly in this data set is also related to history. President Grover Cleveland was elected twice, but not in successive terms. His name appears on the list of data twice, but should only be included in the data set once! Also, he wouldn’t count in the list of presidents who had the same last name as he is himself. History and math are great!
From Grade 2 on, students should be able to make a line plot. Having made the line plot, student can then answer questions. Here is a list of sample questions for a presidential name line plot: these range from simple to complex. You will have to decide how far your students are ready to go, based on their age and mathematical sophistication:
- How long is the shortest name? How long is the longest name?
- How many names have six letters?
- Are there more names with seven letters than eight letters?
- How many more names have six letters than four letters?
- How many names are shorter than six letters?
- How many names are at least eight letters long?
- Which are generally longer, the Presidents’ first names or last names? Which presidents break that rule?
- What is the average length of the names?
- What is the range of the length of the names?
- What is the median and mode of the length of the names?
- How do the mean, median, and mode of the first and last names compare? What does that mean about the length of first and last names?
- What is the interquartile range of the length of the names?
- Can you make a box-and-whiskers plot of the length of the names?
- How do the box-and-whiskers plots of the first and last names compare? How does that compare to the line plots? What does that mean about the length of first and last names?
As you can see, the analysis of line plots can span quite a range of difficulty. That’s why it is so important for students to learn how to create them at the earlier grade levels, answering simple questions. In my role as a school data analyst (alongside my teaching responsibilities), I use line plots all the time in order to understand how my students are doing. Comparing two line plots (such as presidential first and last names) prepares students to analyze data in science, technology, and engineering activities in school and beyond.
There are many additional questions that can be asked about the data that are appropriate for any age. Students will have to come up with a search strategy to systematically go through the data in order to come up with the answers. Fortunately, the questions are quite simple for students to grasp:
-
How many presidents had the same last name? (five pairs of presidents)
-
What are the first names that appear more than once on the list? (Andrew, Franklin, George, James, John, William)
-
What is the most common first name for presidents? (James, five times)
The question about last names also makes a great connection between history and analysis of the data. What was the relationship between the presidents who had the same last name? Is it common for families to have more than one member as presidents? Were they spread out through the years or more common in one era? As I said at the beginning of this post, I love how we can use math to investigate and understand history! I wish that connection had been more present for me when I was a school-aged boy.
Final Notes
The download for this post contains a list of the presidents’ first and last names, a template for students to create their line plots, and the questions above, which can serve as a model for the kind of questions you want to ask them.
While the template is great, you might also want to have students create their own line plot from scratch. It releases more responsibility to them if they already know how to make line plots. Choosing how to lay it out on the paper, choosing an axis scale, determining the colors and types of labels or titles needed can be made their responsibility. If students are new to line plots, I would recommend using the template.
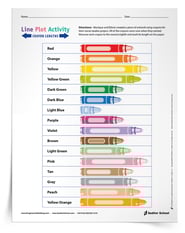 Another line plot activity for upper elementary grades includes measuring to halves, quarters, and eighths. Students measure the length of crayons and then create and interpret line plots. It’s useful not only for data analysis but for students to solidify their understanding of halves, fourths, and eighths, and to apply that understanding through an activity. Download the Crayon Lengths Line Plot Activity now.
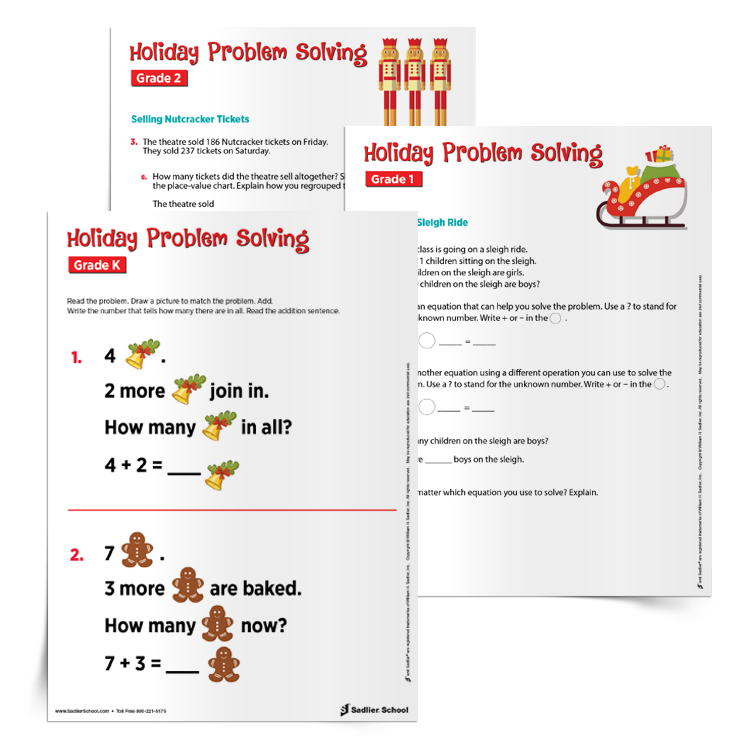
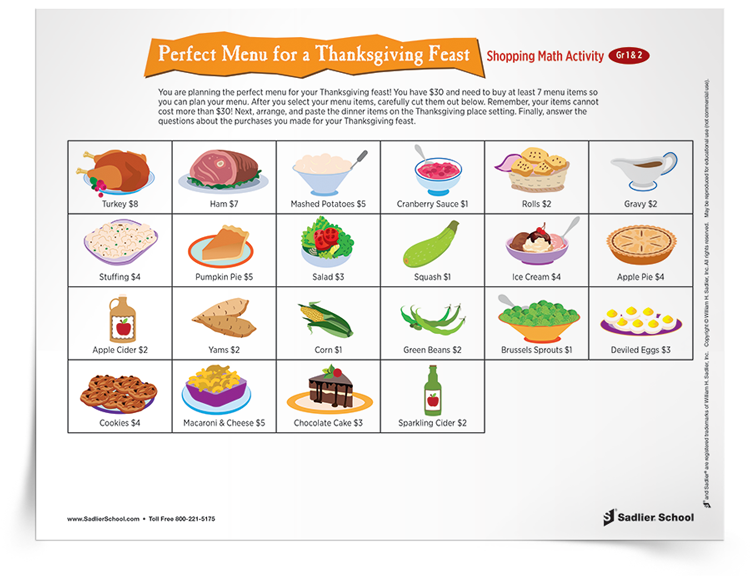
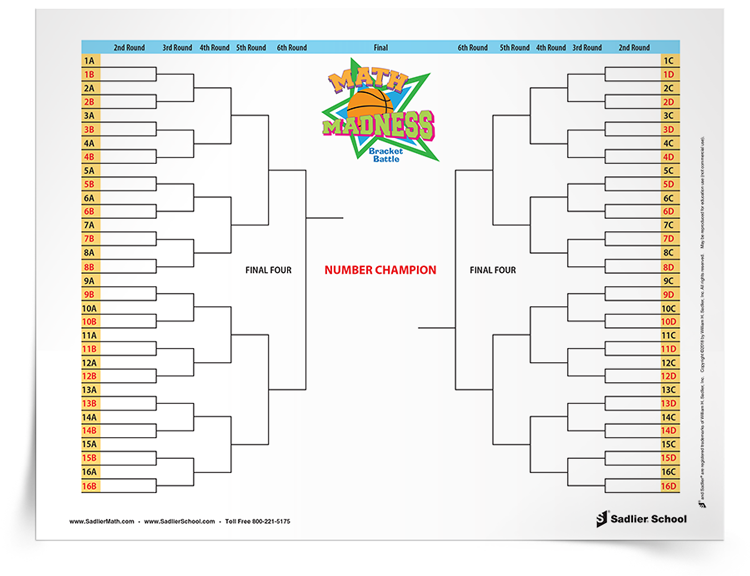
Bonus Seasonal and Holiday Math Worksheets