

January 25, 2018 3-5-measurement-and-data, 3-5-statistics-and-probability, 6-8-statistics-and-probability
By: Jeff Todd
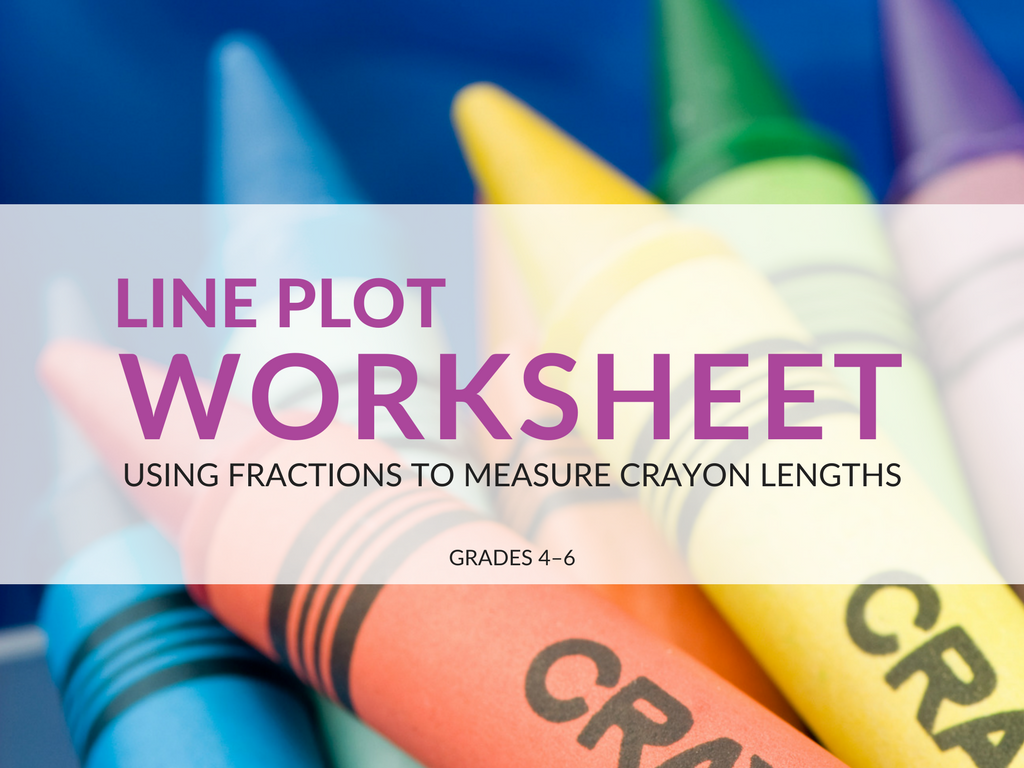
In this post, I share a great line plot activity for late elementary or middle school students. I highly recommend this line plot worksheet because it brings together several topics in one activity. Students use their developing knowledge of fractions, (halves, quarters, eighths), hone their ability to measure objects, and practice displaying and analyzing data using line plots. You can download the line plot worksheet and use it in your classroom today.
Download the FREE Crayon Lengths Line Plot Worksheet now!
One of the standards for the upper elementary grades is to collect data and construct line plots using halves, quarters, and eighths. Students collect and analyze data using a line plots activity in earlier grades, but starting Grade 4 with students’ expanding knowledge about fractions allows them to measure objects to a much higher degree of accuracy.
One great idea is to connect the measurement of items with a science or other interdisciplinary lesson. You could measure the growth of plants, the length of pine needles or of other leaves collected outside. The standards mention measuring the length of insects, but there are many possibilities. You can use the ideas presented here to create such an interdisciplinary lesson, but if you are looking for a stand-alone activity, have students complete the Crayon Lengths Line Plot Activity.
PRINTABLE LINE PLOT WORKSHEET FOR STUDENTS
HERE'S HOW IT WORKS...
This activity is based on a situation: Monique and Edwin were using crayons to create piece of artwork for their social studies project. They had sixteen crayons. All of the crayons were new when they started coloring.
Students measure the length of the crayons in inches from the worksheet, marking how long each crayon is right on the page. This is one of the critical aspects of this activity— students will construct the scale counting by eighths. If you want to give your students the range to construct the line line plot, from one inch to four inches would be sufficient.
Note: Students will need a ruler that is marked in eighths (or sixteenths).Then they will need to construct the scale for the line plot.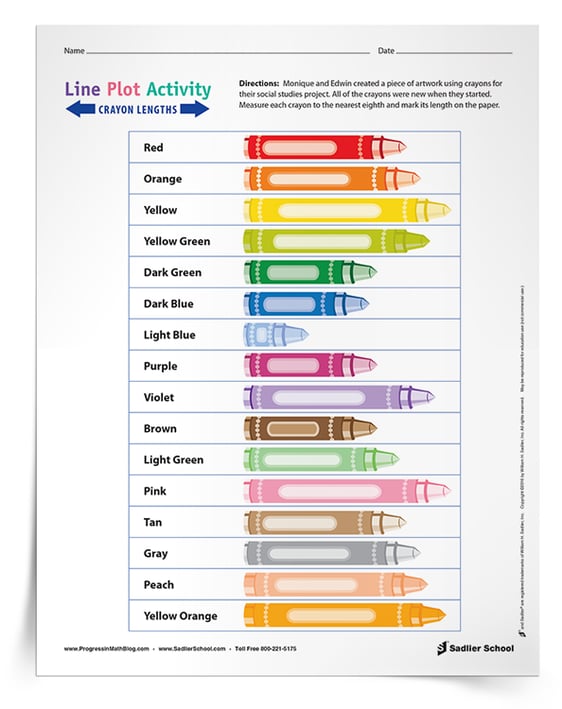

Here are some questions that you can ask students once they have completed their line plot activity. I like to use Bloom’s Revised Taxonomy (Anderson and Krathwohl, 2001) when I construct questions. Here are several questions at an increasing level of cognitive demand, based on Bloom’s taxonomy. These questions span the grade level requirements from Grades 4 to 6.
-
How did you construct the scale for the line plot?
-
Did you use 2/8 or 1/4 on the line plot? Why?
-
How long is the shortest crayon? How long is the longest crayon?
-
What is the most common length of the crayons?
-
Is your line plot the same as or different than line plots created by other students?
-
Are there any outliers in the data?
-
Why are there no crayons longer than 3½ inches?
-
Which colors did they use more of? Which colors did they use less of? Which color did they not use at all?
-
Based on the colors they used or didn’t use, what do you think they were drawing?
-
What is the difference in length between the longest and the shortest crayon? (Grade 5)
-
What is the average length of the crayon? (Grade 6)
-
What is the median length of the crayon? (Grade 6)
Download and print the Crayon Lengths Line Plot Activity for your classroom. It includes a page for students measure the lengths of the crayons, directions and a pre-printed line plot, and a page with sample answers!
ADDITIONAL RESOURCES:
|
|
|