


March 23, 2021 6-8-statistics-and-probability
By: Jeff Todd
Recently, I was working with some of my students on topics they had failed in last year’s state testing. The topic of the day was mean absolute deviation, and while they were able to perform the calculations, they were struggling with the concept of statistical variability.

Strengthen Understanding of Mean Absolute Deviation
To help them, I developed a Variability in Basketball Activity and used it with my students. This activity helped to start conversations about a real life situation (basketball) they could relate to. We were able to talk about the variability in the basketball scores quite naturally. That gave more meaning to the mean absolute deviation that they were calculating.
I was very surprised to discover that developing an understanding of the concept of statistical variability is now part of the Grade 6 Common Core State Standards in math. At best, this was previously a topic in high school statistics courses and not part of middle school mathematics.
The purpose of this post is to assist you in helping your students overcome their confusion with mean absolute deviation and understand what variability is using my basketball scores concept.
I've created a Variability in Basketball Activity you can download and use in the classroom. It would also be a great exercise to do during professional development days with some of your colleagues in order to strengthen your collective skills in this area.
Also please note that the names used for for this activity are gender neutral. Chris and Terry could be male or female. If you are interested in addressing students’ assumptions about gender, listen carefully for their use of pronouns (he/she) as they discuss this activity.


Help Middle School Students Understand Variability
What the Current Standards Ask of Students
The two main topics in studying basic statistics are center and spread.
Middle school math has always included the study of measures of center (mean, median, and mode), but the idea of studying spread (variability) is new to the curriculum, particularly for teachers who have not necessarily studied statistics in detail.
What is Variability?
Variability describes how much a data set changes from element to element. Measures of variability describe the degree and amount of change within the data set. There are two ways that standards ask sixth grade students to calculate variability: the interquartile range and the mean average deviation.
When I was teaching eighth, ninth, and tenth grade math, we often made box and whiskers plots when studying statistics and the idea of interquartile range was a topic we touched on—at those grade levels. The current standards ask us to go deeper than simply performing calculations such as these, all the way to helping students understand what variability is.
What is Mean Absolute Deviation?
The new topic for middle school teachers and students is mean absolute deviation.
Mean absolute deviation describes variation in a data set and is the average distance between each data value and the mean. It can be calculated by finding the difference of each data value and the mean and then finding the average of that. Mean absolute deviation reveals how "spread out" the values are and how much the data vary.
Here is an example to help promote understanding of that topic and variability (spread).
Calculating Variability: The Basketball Example
About the line plot
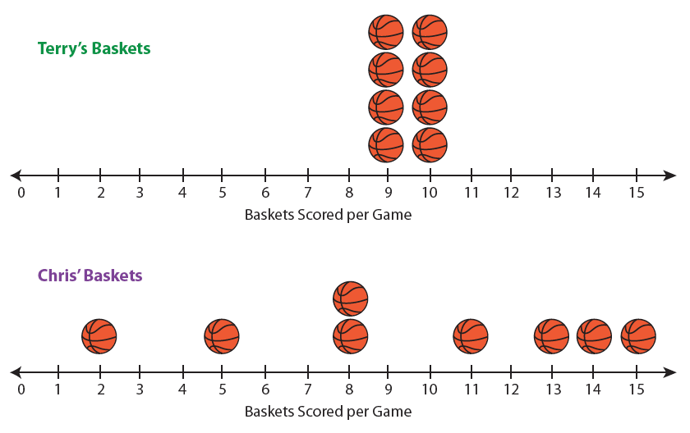
Chris and Terry are basketball players. After the first eight games of the season, the coach analyzes their performance and creates a line plot of the number of baskets each player scored during these games.
After the first eight games of the seasons, they have made the following number of baskets:
Analyzing the line plot
If you calculate the measures of center using the mean and the median, you will find that Chris and Terry have mean of 9.5 baskets per game and a median of 9.5 baskets per game. By only looking at these measures of center without looking at the line plot, we might assume that these players perform equally well on the basketball court.
However, this is not the case. In fact, the players are quite different, and having students (or other teachers, if you are using this for professional development) explain how they are different can help promote an understanding of how to describe variability. Terry is a very consistent player, scoring either nine or 10 baskets every game. Chris’s results on the court have been much more variable. Sometimes Chris has a great game, and sometimes not. Chris’s scores are spread out, while Terry’s scores are all close to the mean and the median.
Having discussed the differences between the two players, it is now more meaningful for students to calculate the mean absolute deviation for each player. Terry’s mean absolute deviation is 0.5; in fact, all of Terry’s scores are exactly 0.5 away from the mean and median. The mean absolute deviation of Chris’s scores is 3.75. These scores are further away from the mean and median. Lower mean absolute deviations (closer to zero) indicate less variation, while higher mean absolute deviations show more variation.
In Summary
I hope this post has helped you know how to strengthen your students' understanding of mean absolute deviation—or even your own understanding. Download the Variability in Basketball Activity to use with your middle school students or for a professional development session. It includes the above example, guiding questions, sample responses, and the calculations for the mean absolute deviation for both players.